
GRUPO LAMOSA S.A.B. DE C.V. AND SUBSIDIARIES
(Figures expressed in millions of current pesos)
| 2020 | 2021 | 2022 | 2023 | VAR% 23-22 | |
| RESULTS1 | |||||
|---|---|---|---|---|---|
| Net Sales | 19,473 | 27,187 | 35,412 | 31,572 | (11) |
| Foreign Sales2 | 5,735 | 10,363 | 14,868 | 11,919 | (20) |
| Foreign Sales / Net Sales | 29% | 38% | 42% | 38% | |
| Operating Income | 3,549 | 6,436 | 6,767 | 4,932 | (27) |
| Operating Income / Net Sales | 18% | 24% | 19% | 16% | |
| Comprehensive Financing Cost | 932 | 719 | 639 | (20) | (103) |
| Consolidated Net Income | 1,663 | 3,429 | 4,201 | 3,251 | (23) |
| FINANCIAL POSITION | |||||
| Total Assets | 24,633 | 32,360 | 36,051 | 43,816 | 22 |
| Total Liabilities | 13,161 | 19,002 | 20,177 | 27,692 | 37 |
| Stockholders’ Equity | 11,472 | 13,358 | 15,873 | 16,125 | 2 |
| Book Value per Share3 | 29.7 | 34.6 | 41.1 | 41.8 | 2 |
| CASH FLOW | |||||
| EBITDA4 | 4,277 | 7,334 | 8,101 | 6,206 | (23) |
| Capital Expenditures5 | 343 | 5,601 | 4,008 | 8,950 | 123 |
| NUMBER OF EMPLOYEES | |||||
| Total Personnel | 7,325 | 9,737 | 11,299 | 11,543 | 2 |
(1) In accordance with applicable International Financial Reporting Standards.
(2) Includes sales of subsidiaries in foreign markets and export sales from Mexico.
(3) On a total of 385.8 million shares.
(4) Operating income plus asset depreciation, amortization and deterioration.
(5) Includes investments in property, plant and equipment, intangibles and the acquisition of subsidiaries.
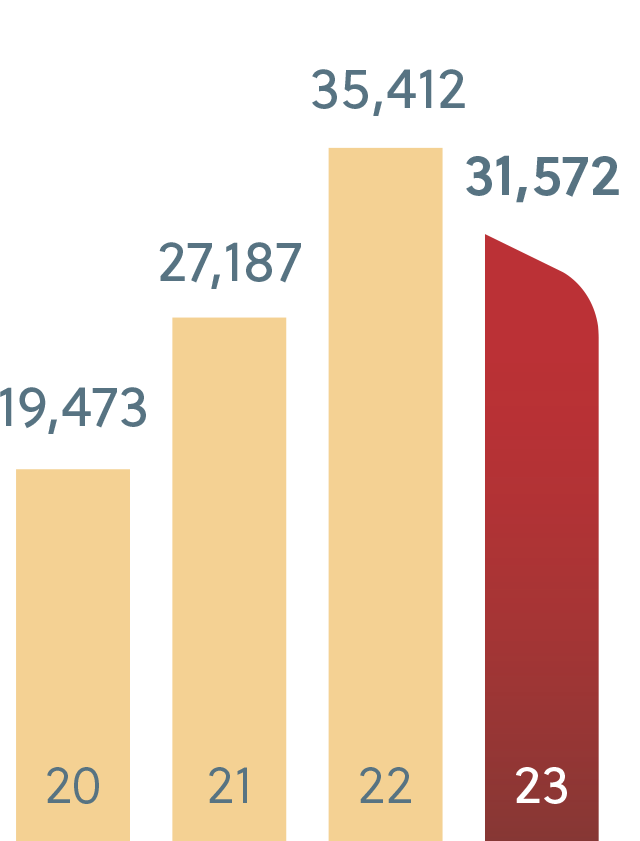
Net Sales
Millions of Mexican pesos
+17%
Compound annual
growth ’20-’23
-11%
Growth
2023 vs. 2022

Foreign Sales
Millions of Mexican pesos
+28%
Compound annual
growth ’20-’23
-20%
Growth
2023 vs. 2022
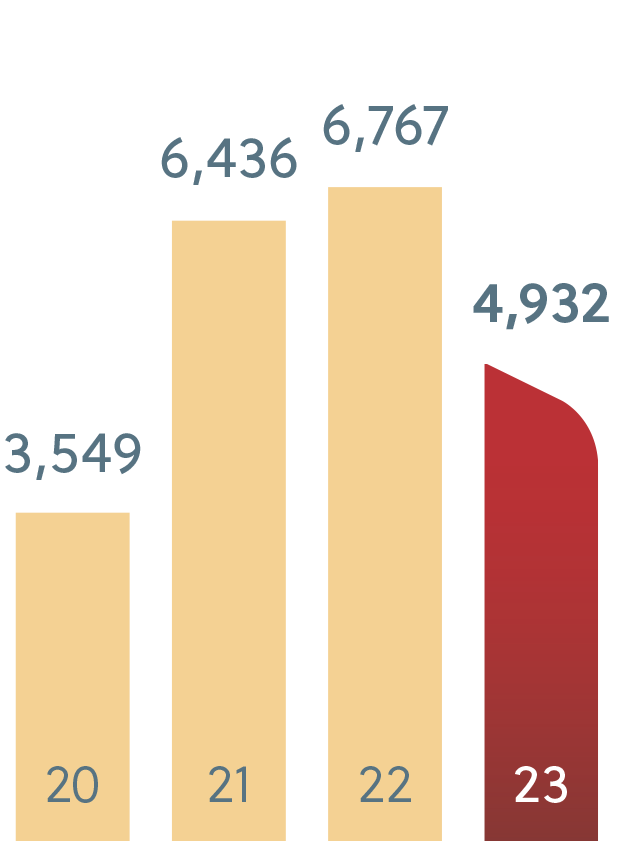
Operating Income
Millions of Mexican pesos
+12%
Compound annual
growth ’20-’23
-27%
Growth
2023 vs. 2022
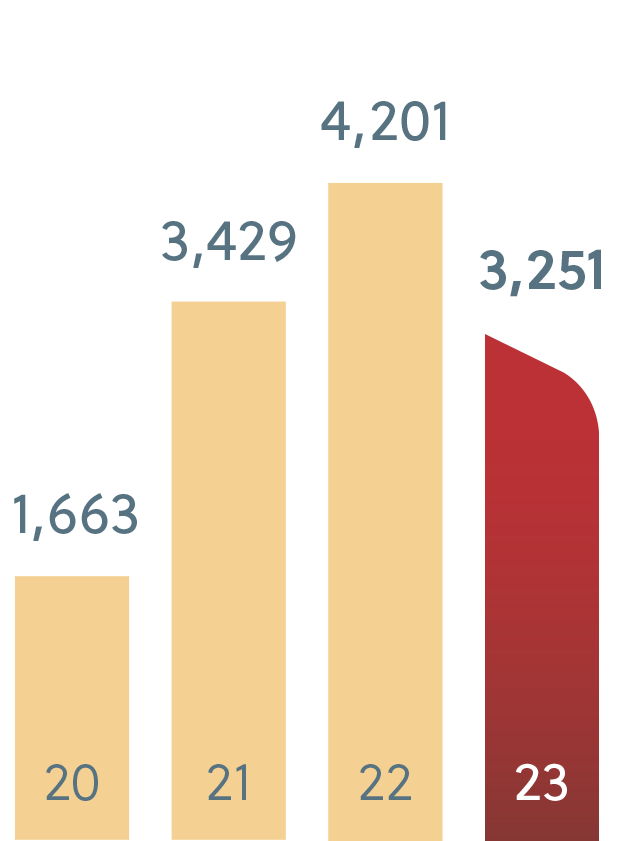
Consolidated Net Income
Millions of Mexican pesos
+25%
Compound annual
growth ’20-’23
-23%
Growth
2023 vs. 2022
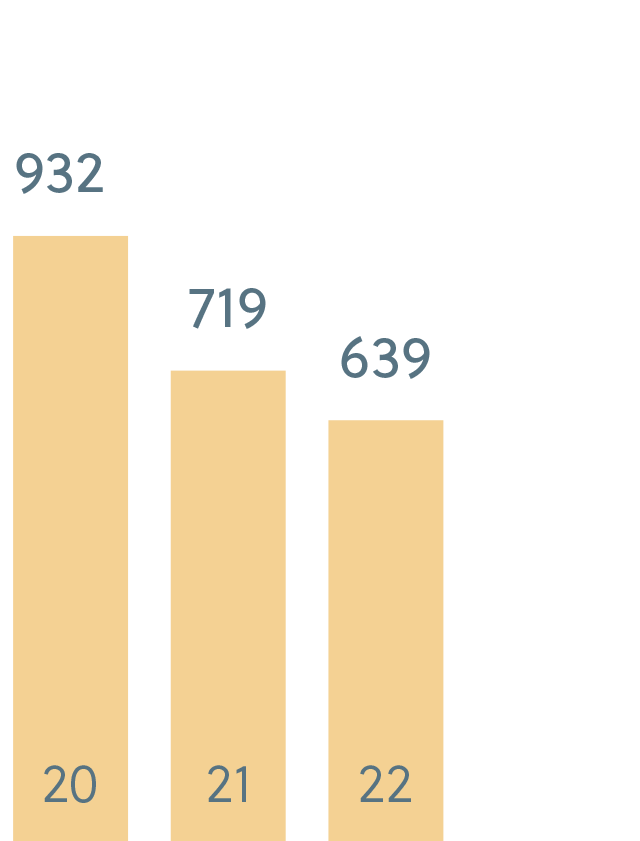

Comprehensive Financing Cost
Millions of Mexican pesos
+128%
Compound annual
growth ’20-’23
-103%
Growth
2023 vs. 2022
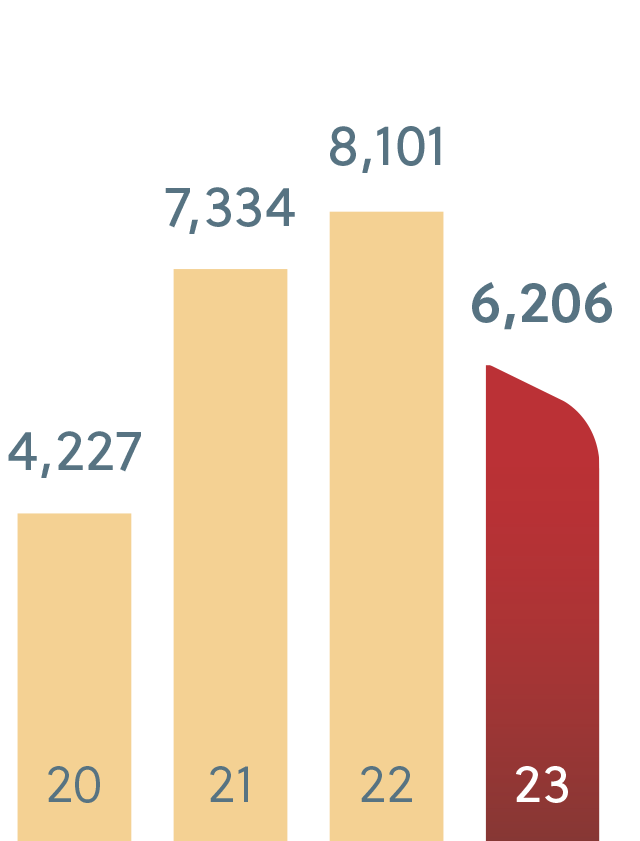
EBITDA
Millions of Mexican pesos
+13%
Compound annual
growth ’20-’23
-23%
Growth
2023 vs. 2022