GRUPO LAMOSA S.A.B. DE C.V. AND SUBSIDIARIES
Figures expressed in millions of current pesos
| RESULTS1 | 2018 | 2019 | VAR % |
|---|---|---|---|
| Net Sales | 17,727 | 17,928 | 1 |
| Foreign Sales2 | 5,625 | 5,247 | (7) |
| Foreign Sales / Net Sales | 32% | 29% | |
| Operating Income | 2,731 | 2,812 | 3 |
| Operating Income / Net Sales | 15% | 16% | |
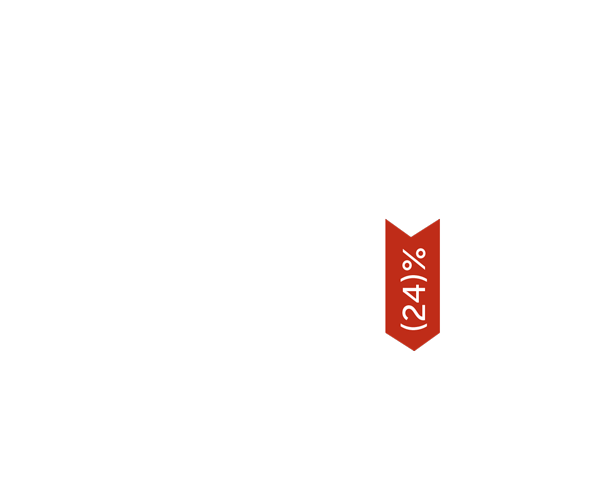
| Comprehensive Financing Cost |
648 | 492 | (24) |
| Consolidated Net Income | 1,355 | 1,427 | 5 |
| FINANCIAL POSITION | |||
| Total Assets | 22,784 | 23,247 | 2 |
| Total Liabilities | 13,452 | 13,150 | (2) |
| Stockholders’ Equity | 9,332 | 10,097 | 8 |
| Book Value per Share3 | 24.2 | 26.2 | 8 |
| CASH FLOW | |||
| EBITDA4 | 3,314 | 3,523 | 6 |
| Capital Expenditures | 757 | 540 | (29) |
| NUMBER OF EMPLOYEES | |||
| Total Personnel | 6,705 | 6,725 | 0 |

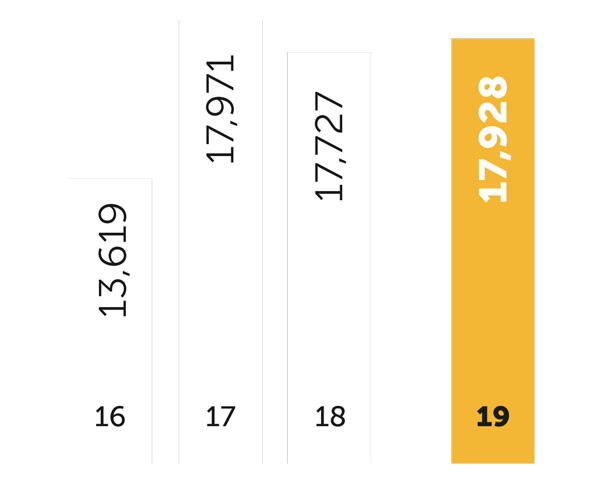
NET
SALES
Millions of pesos

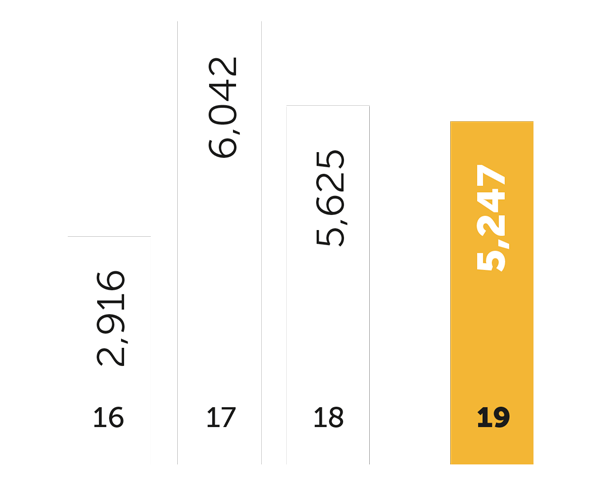
FOREIGN
SALES
Millions of pesos

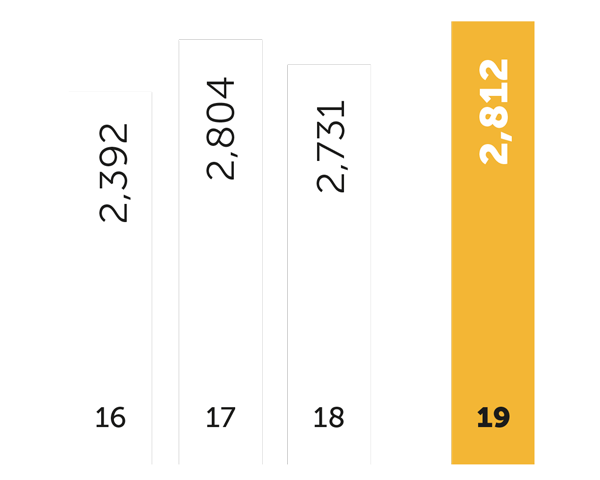
OPERATING
INCOME
Millions of pesos

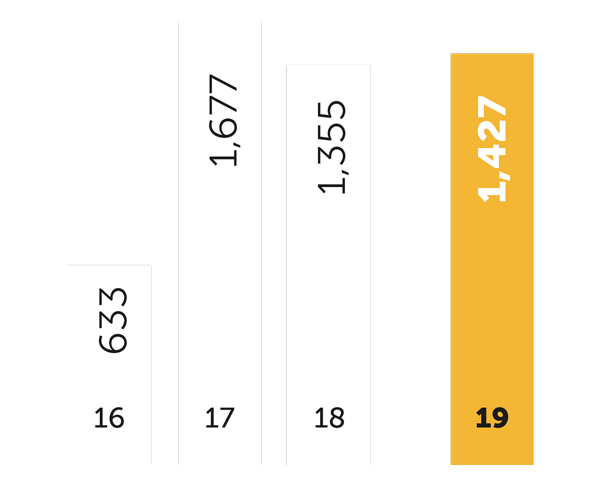
CONSOLIDATED
NET INCOME
Millions of pesos

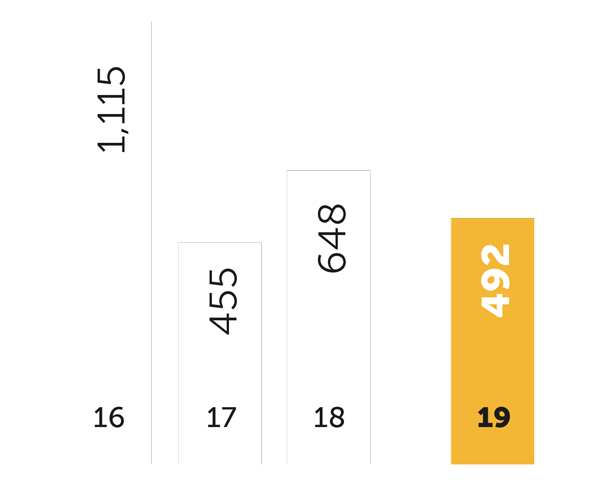
COMPREHENSIVE
FINANCING COST
Millions of pesos

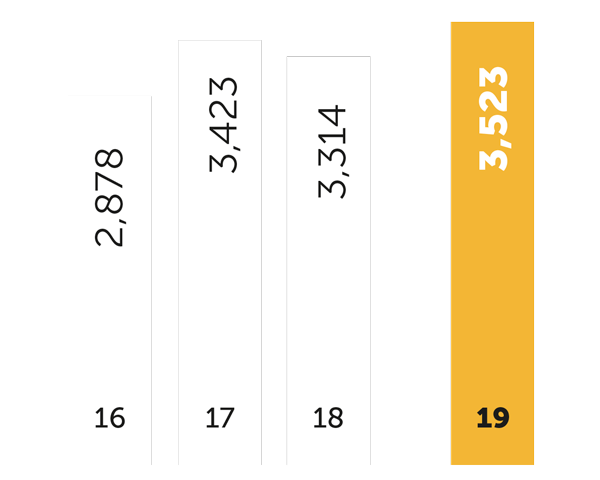

EBITDA
Millions of pesos

NOTES: