Net sales
Millions of Mexican pesos

Consolidated net income
Millions of Mexican pesos

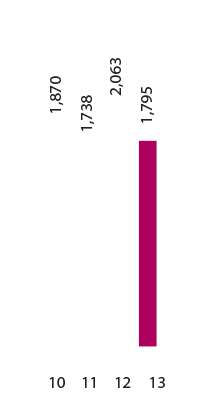
Export sales
Millions of U.S. dollars

Comprehensive financing cost
Millions of Mexican pesos

Operating income
Millions of Mexican pesos

Operating cash flow
Millions of Mexican pesos
Notes
- Figures are in millions of nominal Mexican pesos, except for the graph of export sales.
- Figures corresponding to 2011, 2012 and 2013 in the Company’s Financial Statements are calculated according to International Financial Reporting Standards (IFRS).