GRI 3-3
GRUPO LAMOSA S.A.B. DE C.V. AND SUBSIDIARIES
(Figures expressed in millions of current pesos)
| 2020 | 2021 | 2022 | 2023 | 2024 | VAR% | |
|---|---|---|---|---|---|---|
| RESULTS1 | ||||||
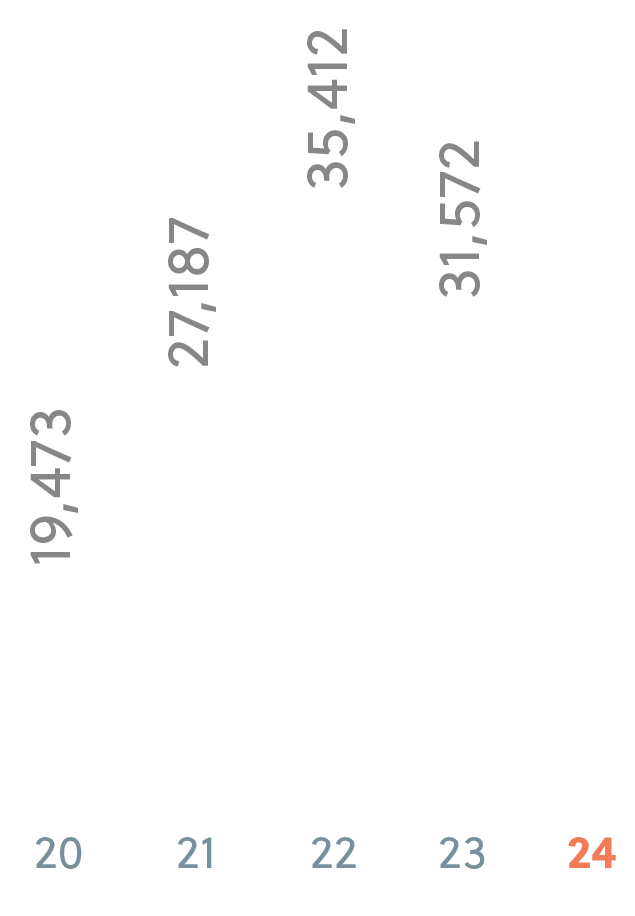
| Net Sales | 19,473 | 27,187 | 35,412 | 31,572 | 33,945 | 8 |
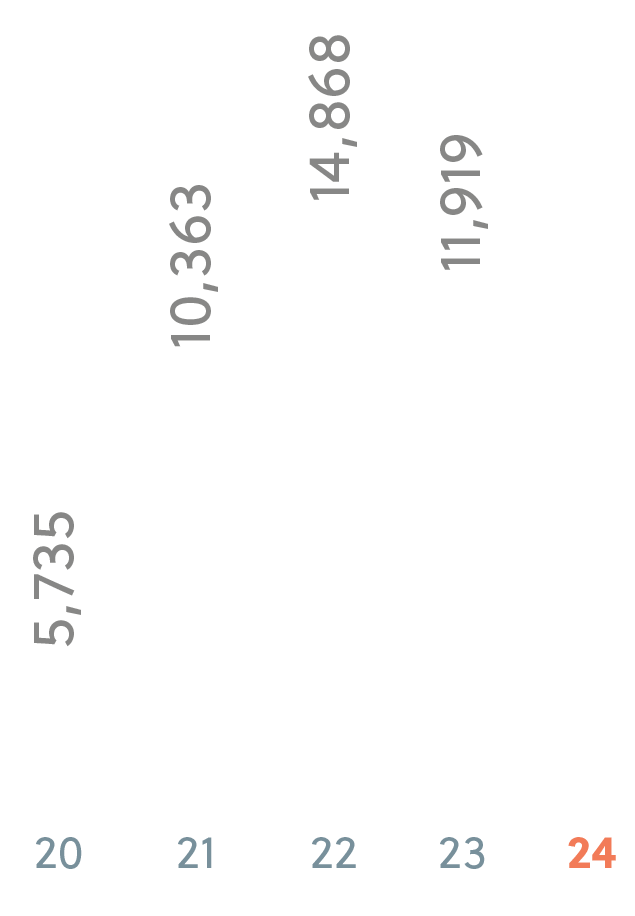
| Foreign Sales2 | 5,735 | 10,363 | 14,868 | 11,919 | 14,392 | 21 |
| Foreign Sales / Net Sales | 29% | 38% | 42% | 38% | 42% | |
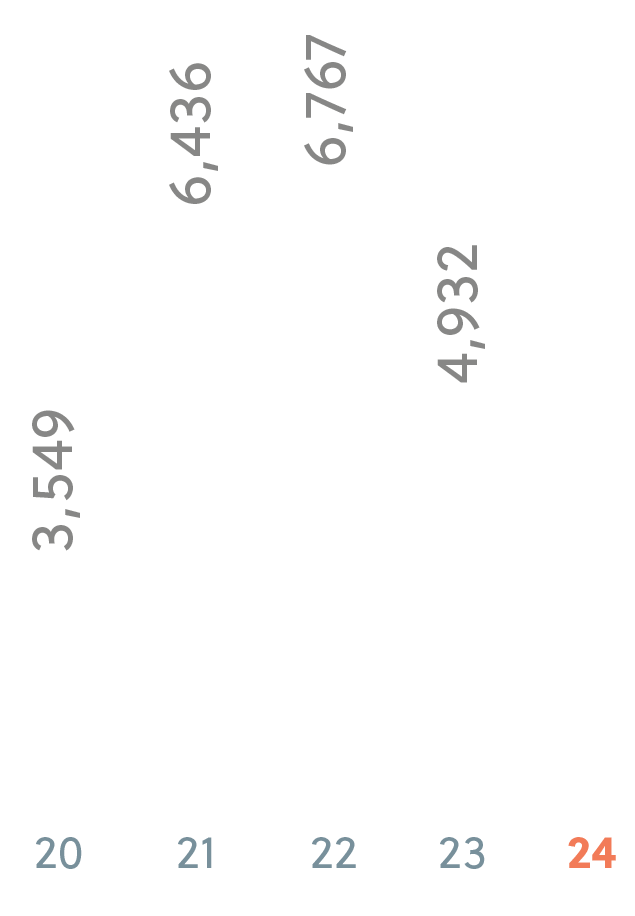
| Operating Income | 3,549 | 6,436 | 6,767 | 4,932 | 4,522 | (8) |
| Operating Income / Net Sales | 18% | 24% | 19% | 16% | 13% | |
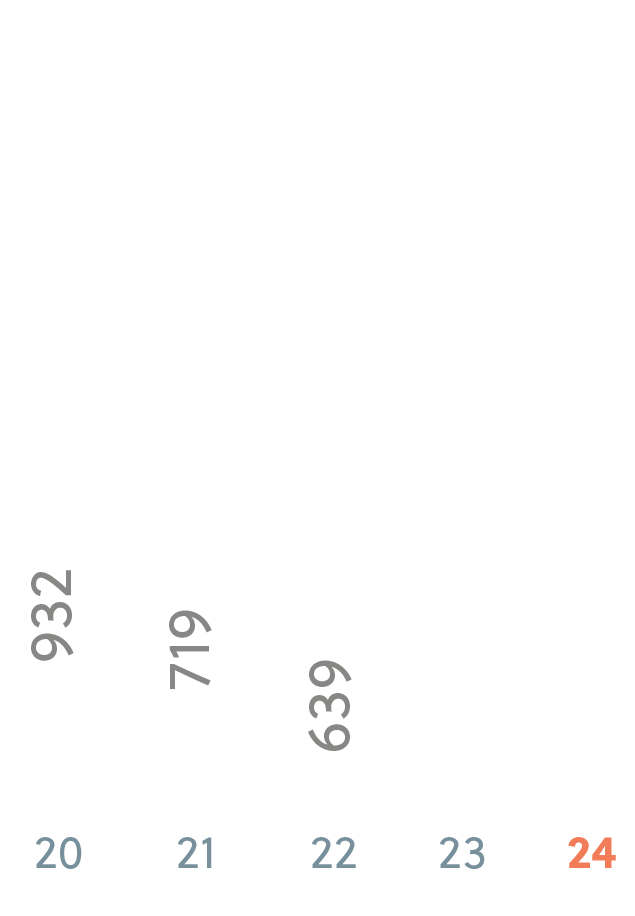
| Comprehensive Financing Cost | 932 | 719 | 639 | (20) | 3,821 | |
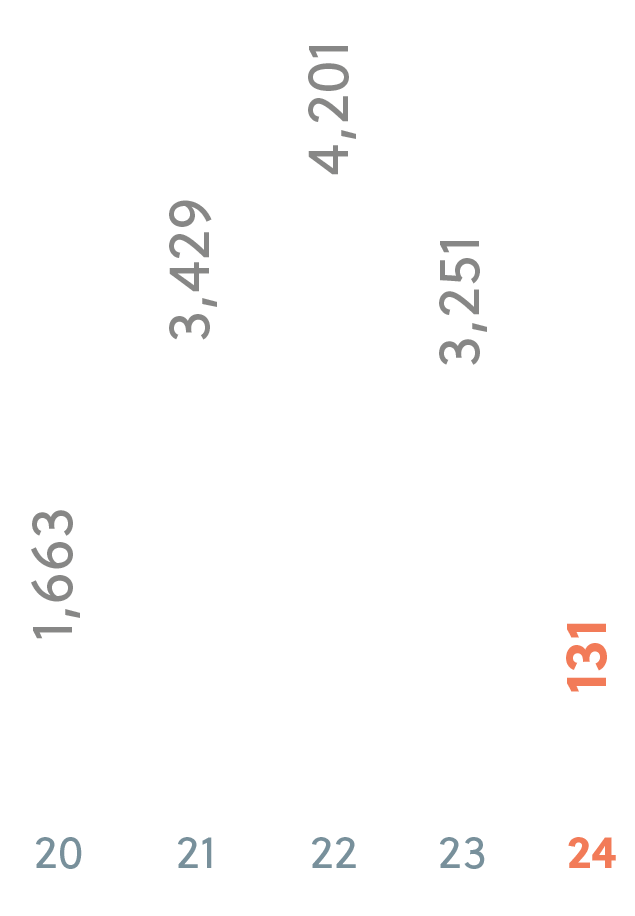
| Consolidated Net Income | 1,663 | 3,429 | 4,201 | 3,251 | 131 | (96) |
| FINANCIAL POSITION | ||||||
| Total Assets | 24,633 | 32,360 | 36,051 | 43,816 | 47,145 | 8 |
| Total Liabilities | 13,161 | 19,002 | 20,177 | 27,692 | 28,990 | 5 |
| Stockholders’ Equity | 11,472 | 13,358 | 15,873 | 16,125 | 18,156 | 13 |
| Book Value per Share3 | 29.7 | 34.6 | 41.1 | 41.8 | 47.1 | 13 |
| CASH FLOW | ||||||
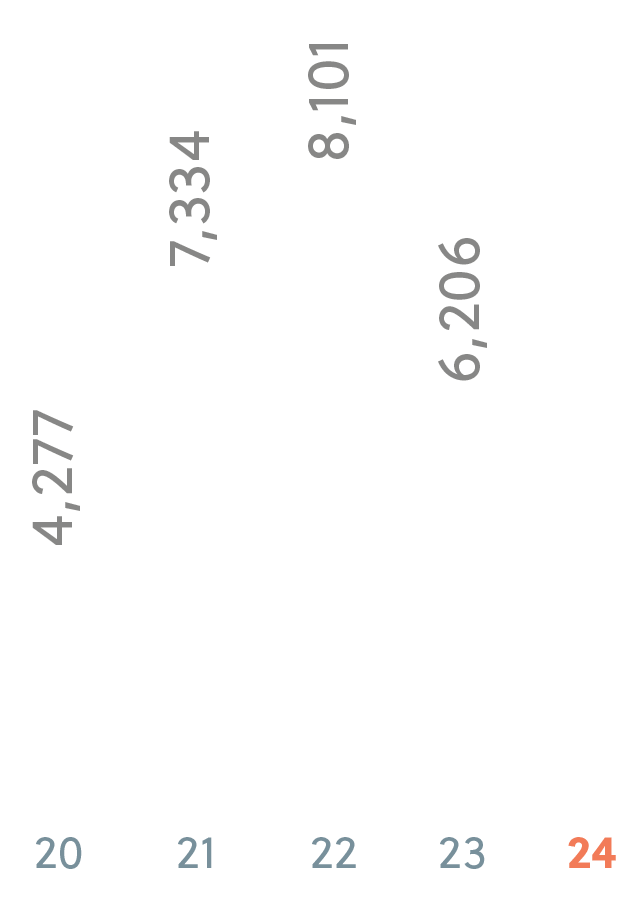
| EBITDA4 | 4,277 | 7,334 | 8,101 | 6,206 | 6,208 | 0 |
| Capital Expenditures5 | 343 | 5,601 | 4,008 | 8,950 | 1,282 | (86) |
| PERSONNEL | ||||||
| Total Employees | 7,325 | 9,737 | 11,299 | 11,543 | 10,829 | (6) |
| (1) In accordance with applicable International Financial Reporting Standards. (2) Includes sales of subsidiaries in foreign markets and export sales from Mexico. (3) On a total of 385.8 million shares. (4) Operating income plus asset depreciation, amortization and deterioration. (5) Includes investments in property, plant and equipment, intangibles and the acquisition of subsidiaries. |
||||||