FINANCIAL HIGHLIGHTS
| 2014 | 2015 | VAR% | |
|---|---|---|---|
| RESULTS1 | |||
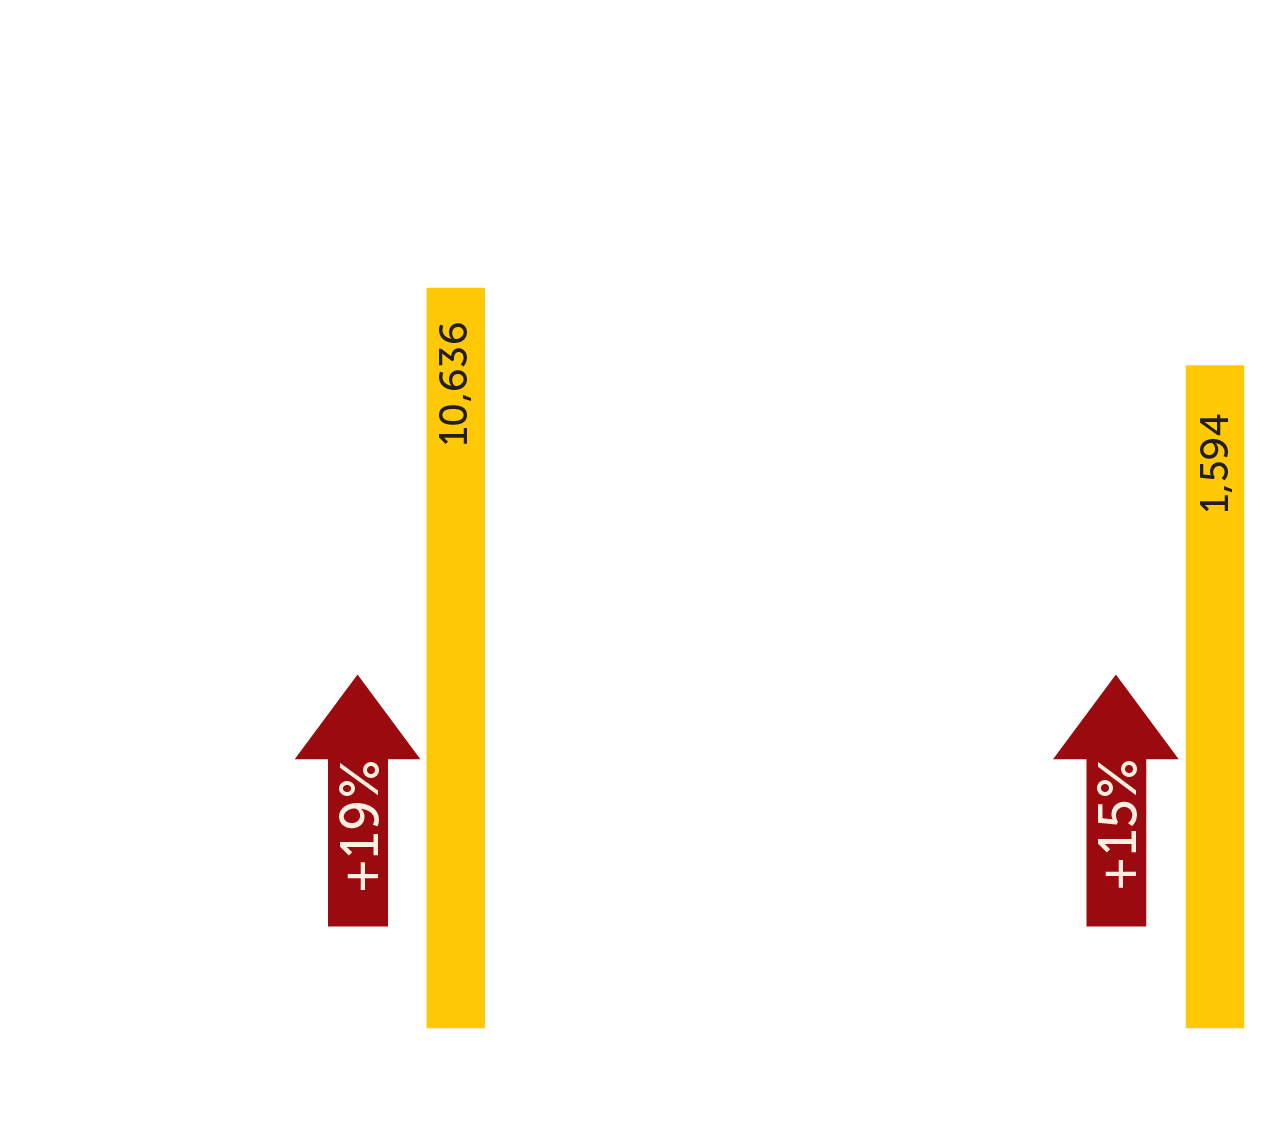
| Net sales | 8.971 | 10,636 | 19 |
| Export sales | 1,387 | 1,594 | 15 |
| Export sales / Net sales | 15% | 15% | |
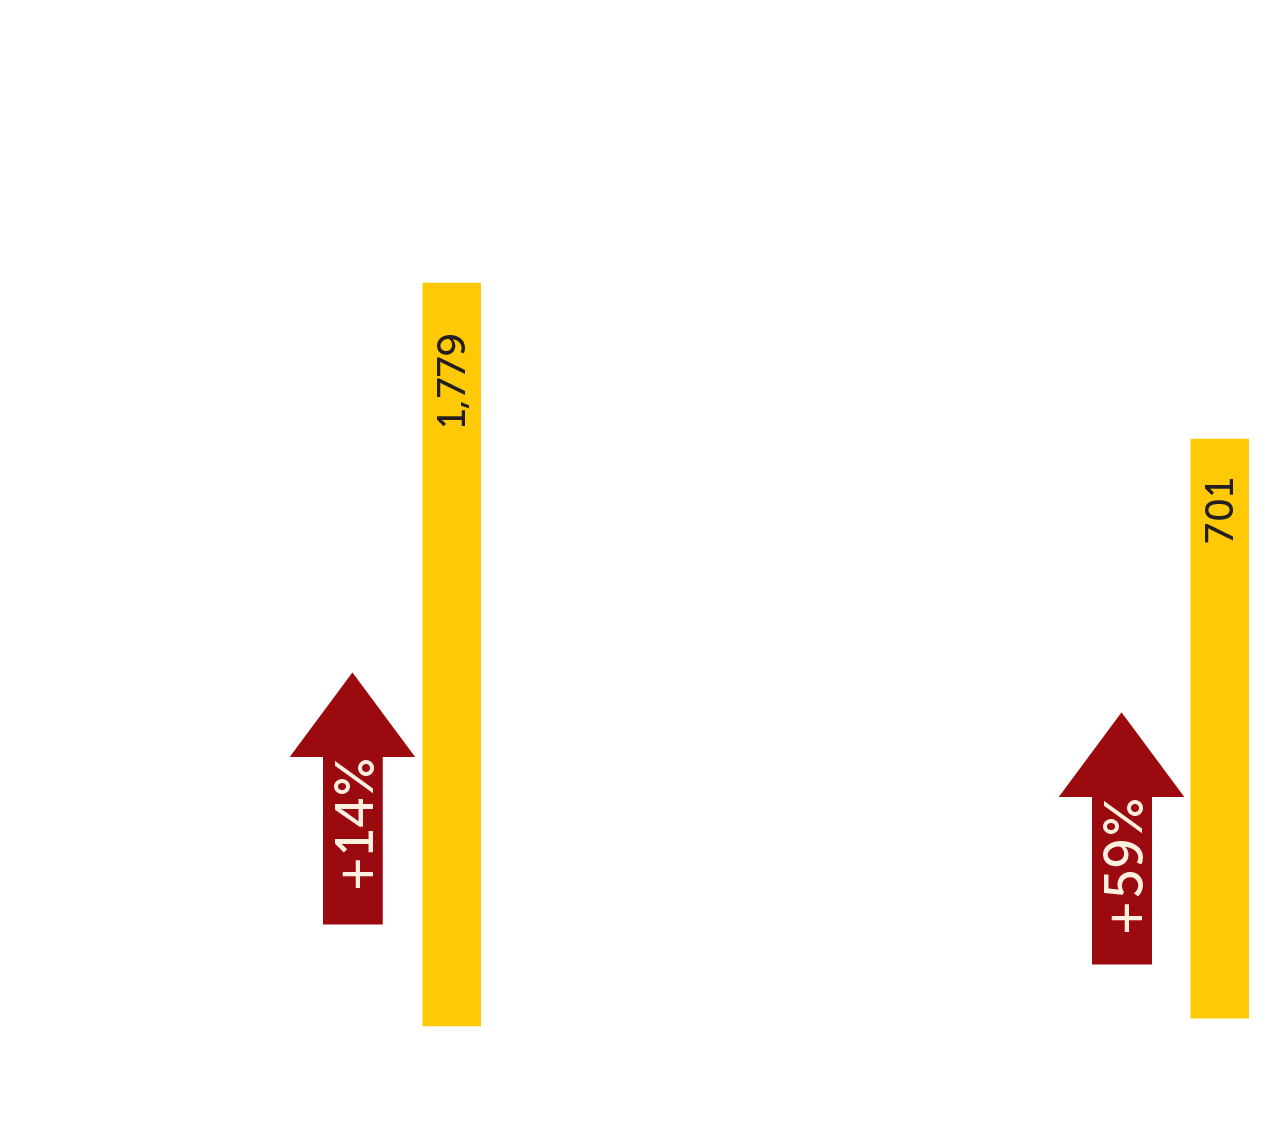
| Operating income | 1,566 | 1,779 | 14 |
| Operating income / Net sales | 17% | 17% | |
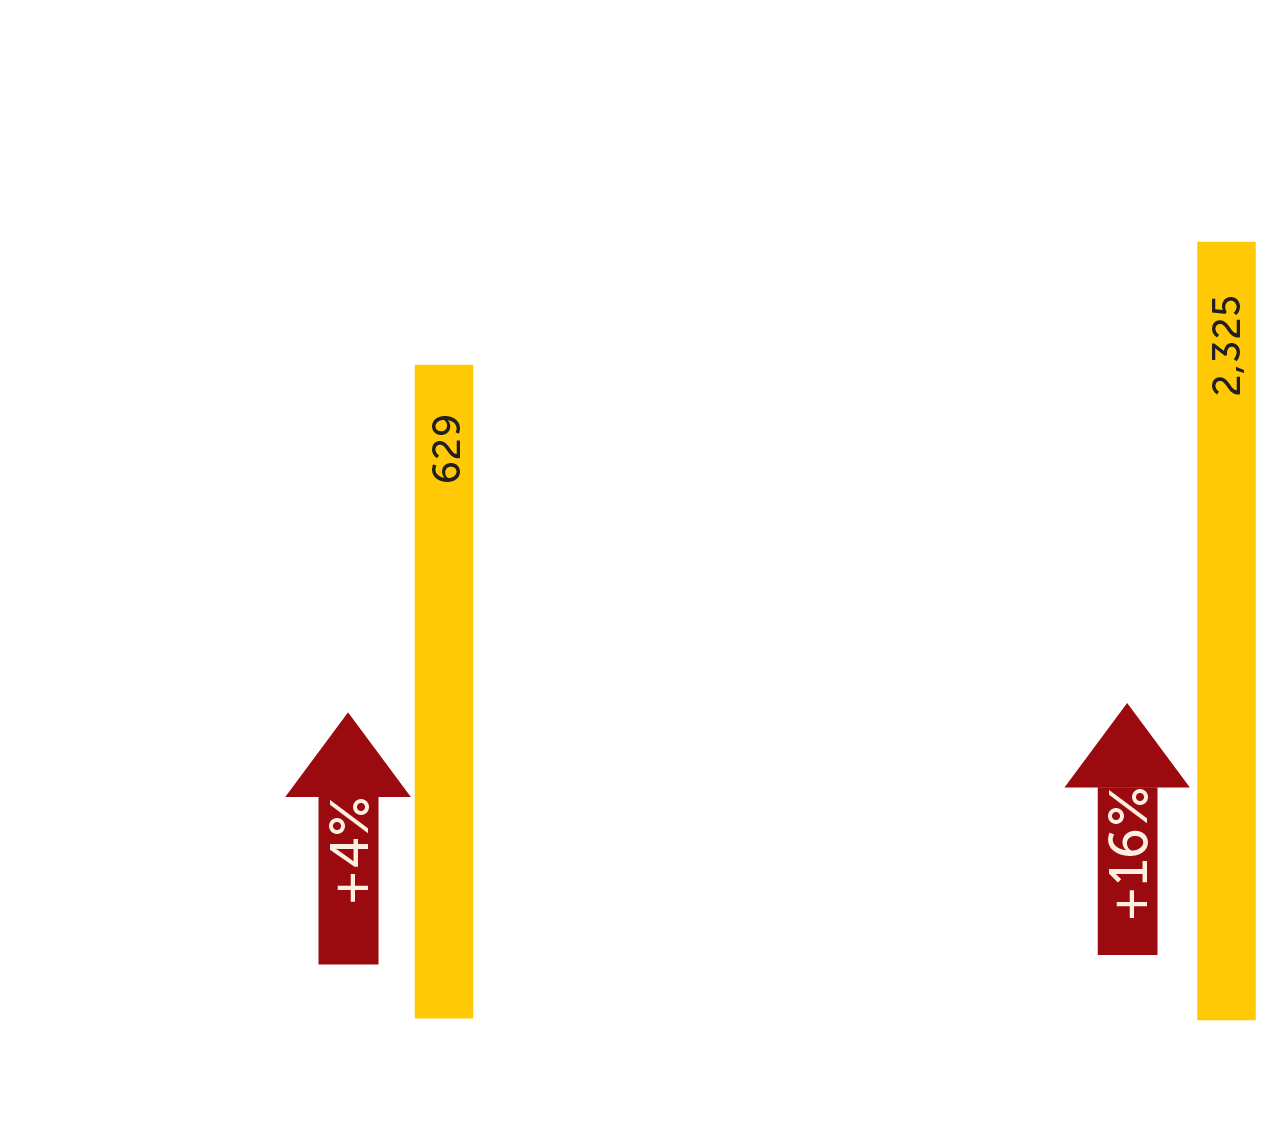
| Comprehensive financing cost | 603 | 629 | 4 |
| Consolidated net income | 442 | 701 | 59 |
| FINANCIAL POSITION | |||
| Total assets | 15,077 | 15,776 | 5 |
| Total liabilities | 9,105 | 9,305 | 2 |
| Stockholders’ equity | 5,972 | 6,471 | 8 |
| Book value per share2 | 15.6 | 16.9 | 8 |
| CASH FLOW | |||
| Operating cash flow (EBITDA)3 | 2,011 | 2,325 | 16 |
| Capital expenditures | 295 | 975 | 231 |
| NUMBER OF EMPLOYEES | |||
| Total personnel4 | 5,600 | 4,663 | (17) |
| (1) In accordance with applicable International Financial Reporting Standards, the results consider Sanitaryware operations as discontinued operations. (2) On a total of 382.1 million shares. (3) Operating income plus depreciation and amortization and other virtual items. (4) 2015 figures exclude personnel of Sanitaryware, which was divested during the second quarter. |
|||
NOTE: For comparative purposes in accordance with International Financial Reporting Standards, figures exclude Sanitaryware operations.